
Methodology
The first task was to gather data from the WCS project and to digitize it into an electronic form so that aspects such as site status, chronological classification and geographical position could be established.
Potential variables relating to site location then needed to be identified. These were established by studying literature on the prehistory of Cyprus where generalisations regarding site location are sometimes mentioned, often in passing and with no substantial evidence to back up claims. Other APM studies were also consulted in an attempt to highlight common factors seen to be relevant to the placement of archaeological sites in general.
Once factors had been selected the relating data was obtained. The lack of available data for this region of Cyprus meant that digitization of maps and other data was undertaken in ArcGIS.
Statistical analysis was then conducted on the relationship between sites and potential factors before further analysis was undertaken on potential confounding and multicollinearity amongst variables. Chi-squared and Kolmogorov-Smirnov tests then allowed for the recognition of anomalies in the presumed standard distributions of the sites (Shennan 1997).
The tests were used to determine the validity of the following hypothesis for each variable:
Null hypothesis (H0): Distribution of sites in the study area is not influenced by the variable and is therefore randomly distributed.
Alternative hypothesis (H1): Distribution of sites in the study area is influenced by the variable and is therefore not randomly distributed.
Once variables which rejected the null hypothesis were identified a further test was performed to establish if the variables were independent of each other, a prerequisite of Dempster-Shafer theory. This was done by using Spearman's rank correlation coefficient in the statistical software package SPSS.
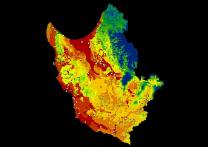
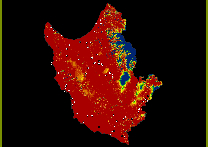
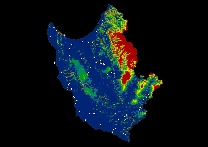
The remaining variable layers were then transferred to IDRISI and prepared for use within the Belief Module which implements Dempster-Shafer theory. It was at this point that the predictive model was constructed and from where output maps were produced to visualise the outcome.